
Category

Market Reviews

Market Review March 2021

Monthly Market Review – March 2021

VIEW PDF

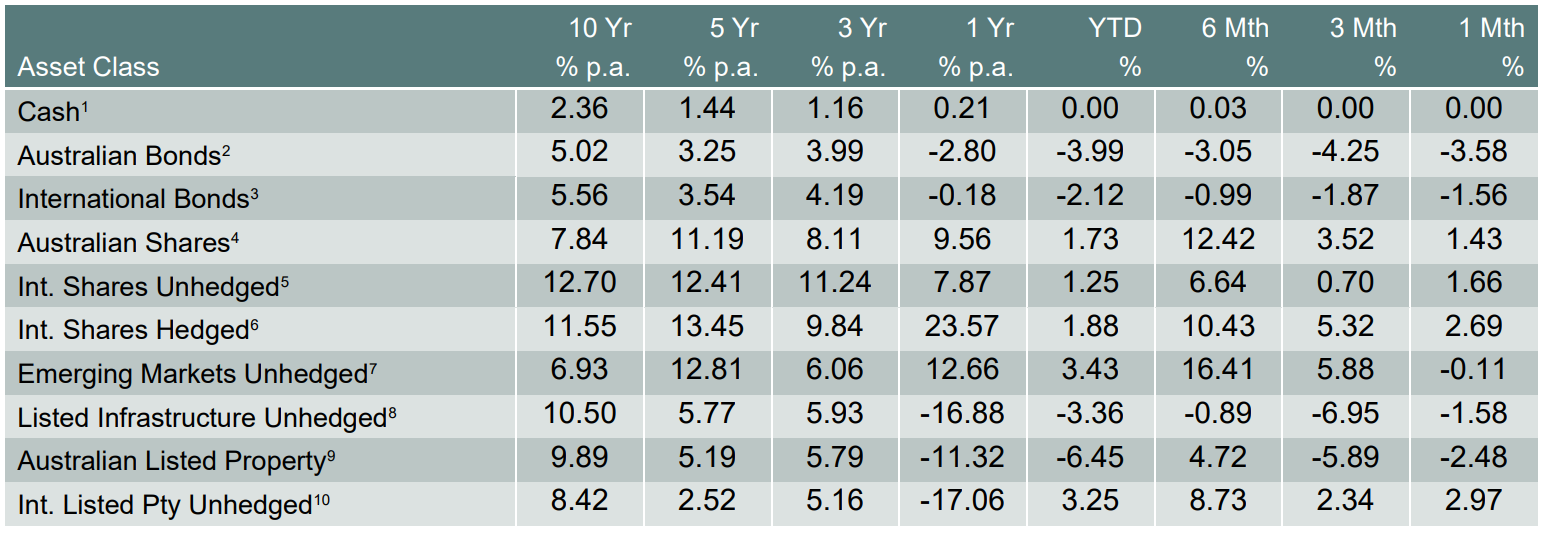
How the different asset classes have fared: (As at 31 March 2021)

1 Bloomberg AusBond Bank 0+Y TR AUD, 2 Bloomberg AusBond Composite 0+Y TR AUD, 3 Bloomberg Barclays Global Aggregate TR Hdg AUD, 4 S&P/ASX All Ordinaries TR, 5 Vanguard International Shares Index, 6 Vanguard Intl Shares Index Hdg AUD TR, 7 Vanguard Emerging Markets Shares Index, 8 FTSE Developed Core Infrastructure 50/50 NR AUD, 9 S&P/ASX 300 AREIT TR, 10 FTSE EPRA/NAREIT Global REITs NR AUD

Domestic and International Fixed Income

After rising sharply in February, US Treasury yields continued to edge higher in March, reflecting an improving outlook for the global economy due to the ongoing rollout of vaccines and the prospect of further significant fiscal stimulus in the US. At the end March, US President Biden announced a US$2.3 trillion “American Jobs Plan”. The plan focusses on infrastructure spending, spread over eight years, and is proposed to be funded by corporate tax increases spread over 15 years. This plan comes on top of a US$1.9 trillion relief package signed into law by President Biden in early March, and a US$900bn emergency relief package paid out in January.

The Biden administration is expected to announce another package in coming weeks focused on childcare, healthcare and education, which will be funded by tax increases on wealthy individuals. As a result of the huge fiscal packages proposed by the Biden administration, the market is expecting the US economy to recover strongly. The markets’ belief in economic recovery and the inflation that may result have been contributing factors to rising bond yields. However, Central banks remain dovish and have reiterated their commitment to keep easy monetary policy in place for an extended period.

After increasing sharply in February, Australian government bond yields declined slightly in March. Bond prices were supported after the RBA reiterated its commitment to its 3-year bond yield target of 0.1% and reinforced its message that they do not expect the cash rate to increase until 2024 at the earliest. In its March meeting press release, the RBA also flagged that they are “prepared to do more” bond purchases if deemed necessary.

Australian Equities

The S&P/ASX All Ordinaries Index rose by 1.8% in March, underperforming a 4% gain (foreign currency hedged) in international share markets. The best performing sectors for the month were consumer discretionary and utilities. The labour market recovered further in February, with a decrease in the unemployment rate to 5.8%. The Australian housing market also continued to rise in March, increasing by 2.8% according to CoreLogic, which is the fastest monthly increase since the late 1980s. Strength in the housing market has been driven by strong demand from first home buyers.

International Equities

International share markets (foreign currency hedged) rallied by 4% in March. Share markets were buoyed by an improving outlook for the global economy due to the ongoing rollout of vaccines, together with the prospect of further significant fiscal stimulus in the US.

The S&P500 rose by 4.4%, driven by strong gains in value-oriented stocks which are expected to benefit from a strong global economic recovery. By contrast, high multiple and long duration growth stocks, such as US technology stocks, underperformed shorter duration and more cyclically levered-value stocks over the month.

European shares rallied in March, while emerging market shares underperformed due to weakness in Chinese equities. Chinese equities were reportedly weighed down by concerns around earnings and tighter liquidity conditions from the People’s Bank of China.

Australian Dollar

The Australian dollar decreased modestly in March alongside a decline in iron ore prices (albeit from very high levels) and a narrowing in the spread between Australian and US government bond yields.

Disclaimer

The information contained in this material is current as at date of publication unless otherwise specified and is provided by ClearView Financial Advice Pty Ltd ABN 89 133 593 012, AFS Licence No. 331367 (ClearView) and Matrix Planning Solutions Limited ABN 45 087 470 200, AFS Licence No. 238 256 (Matrix). Any advice contained in this material is general advice only and has been prepared without taking account of any person’s objectives, financial situation or needs.  Before acting on any such information, a person should consider its appropriateness, having regard to their objectives, financial situation and needs. In preparing this material, ClearView and Matrix have relied on publicly available information and sources believed to be reliable.  Except as otherwise stated, the information has not been independently verified by ClearView or Matrix. While due care and attention has been exercised in the preparation of the material, ClearView and Matrix give no representation, warranty (express or implied) as to the accuracy, completeness or reliability of the information. The information in this document is also not intended to be a complete statement or summary of the industry, markets, securities or developments referred to in the material. Any opinions expressed in this material, including as to future matters, may be subject to change. Opinions as to future matters are predictive in nature and may be affected by inaccurate assumptions or by known or unknown risks and uncertainties and may differ materially from results ultimately achieved. Past performance is not an indicator of future performance.

Market Review February 2021

Monthly Market Review – February 2021

VIEW PDF

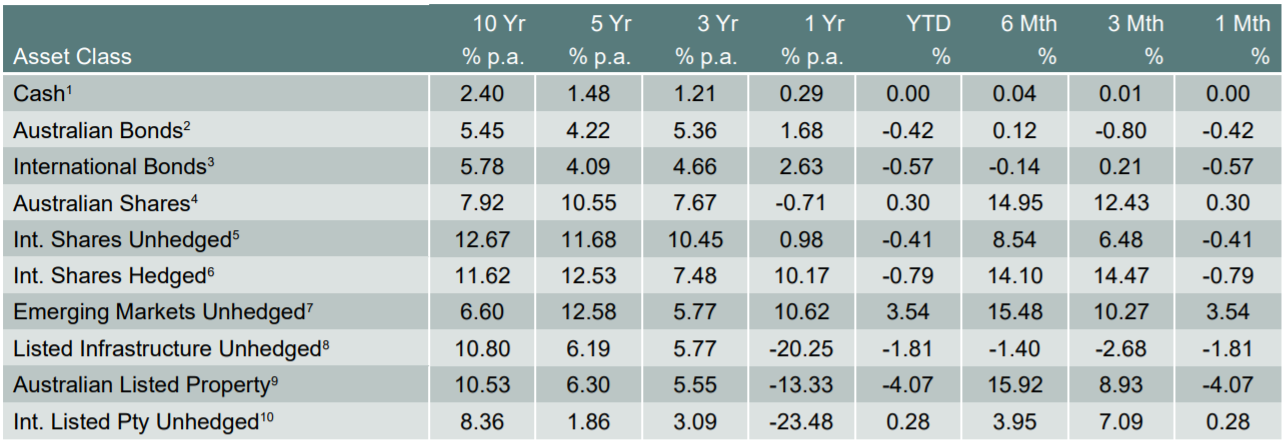
How the different asset classes have fared: (As at 28 February 2021)

1 Bloomberg AusBond Bank 0+Y TR AUD, 2 Bloomberg AusBond Composite 0+Y TR AUD, 3 Bloomberg Barclays Global Aggregate TR Hdg AUD, 4 S&P/ASX All Ordinaries TR, 5 Vanguard International Shares Index, 6 Vanguard Intl Shares Index Hdg AUD TR, 7 Vanguard Emerging Markets Shares Index, 8 FTSE Developed Core Infrastructure 50/50 NR AUD, 9 S&P/ASX 300 AREIT TR, 10 FTSE EPRA/NAREIT Global REITs NR AUD

Australian Equities

The S&P/ASX All Ordinaries recorded a gain of 1.43% in February. It was a volatile month for Australian shares due to fears of a return of inflation. The best performing sectors for the month were materials, financials, and energy, which were expected to benefit from an economic recovery as vaccines drive normalisation in the economy and rising bond yields pressure valuations.

Reporting season saw the release of earnings data, with many ASX companies beating expectations. Around 86% of ASX 200 companies reported a profit. The better-than-expected earnings were partly a function of the disruption in 2020 when many companies ditched forecasts entirely, leaving analysts forecasting earnings in the dark, because of the uncertainty stemming from the pandemic.

Australian Property

Whilst listed property fell in February, the residential housing market performed well, rising at its fastest rate in 17 years. The property market has been more resilient than expected, helping the economic recovery and the performance of banks and developers. Much of this growth has been attributed to record low interest rates, multiple government homebuyer and income support measures, pent up demand from lockdowns and a fear of buyers’ missing out.

Australian dollar

Higher than anticipated iron ore prices kept the Australian dollar high, despite the RBA extending its bond-buying program to place downward pressure on the local currency.

International Equities

US Stocks performed well in February with the S&P 500 up 2.61%. This can be attributed to growing optimism surrounding the economic recovery and decreasing number of COVID-19 infections. Nevertheless, attention turned to rising yields on the U.S. 10-year treasury notes. There is growing fear that increasing yields, which are a consequence of an improving economy and greater pricing pressures, will prove competition for stocks. The casualties have been overbought high multiple growth stocks, many of which are traded on the NASDAQ and are tech related. The inevitable stylistic shift back in markets to value-oriented stocks and stocks which are more favourably exposed to rising bond yields appears to be occurring.

Asian and European markets did reasonably well. However, they experienced a strong sell off in the last trading day of the month as investors bet an economic rebound could lead to tighter monetary policy. Technology stocks were hardest hit during the sell off.

Domestic and International Fixed Income

The RBA has an official policy to keep 3-year government bond yields at around 0.1%. To do this, it buys bonds when the yield gets too high. Earlier in the month, the RBA announced another $100 billion in bond purchases, which means the RBA will be buying about $5 billion worth of government bonds every week until at least April. This is intended to help the economy by keeping other interest rates very low. Nevertheless, despite the RBA efforts, long-term 10-year interest rates have doubled since November. That’s because investors are starting to look ahead of the pandemic to possible inflation.

Internationally, central banks from Asia to Europe escalated efforts to calm panicking markets, by pledging to buy more bonds and signaling more policy accommodation, after U.S Treasury yields surged to their highest level in a year.

Disclaimer

The information contained in this material is current as at date of publication unless otherwise specified and is provided by ClearView Financial Advice Pty Ltd ABN 89 133 593 012, AFS Licence No. 331367 (ClearView) and Matrix Planning Solutions Limited ABN 45 087 470 200, AFS Licence No. 238 256 (Matrix). Any advice contained in this material is general advice only and has been prepared without taking account of any person’s objectives, financial situation or needs.  Before acting on any such information, a person should consider its appropriateness, having regard to their objectives, financial situation and needs. In preparing this material, ClearView and Matrix have relied on publicly available information and sources believed to be reliable.  Except as otherwise stated, the information has not been independently verified by ClearView or Matrix. While due care and attention has been exercised in the preparation of the material, ClearView and Matrix give no representation, warranty (express or implied) as to the accuracy, completeness or reliability of the information. The information in this document is also not intended to be a complete statement or summary of the industry, markets, securities or developments referred to in the material. Any opinions expressed in this material, including as to future matters, may be subject to change. Opinions as to future matters are predictive in nature and may be affected by inaccurate assumptions or by known or unknown risks and uncertainties and may differ materially from results ultimately achieved. Past performance is not an indicator of future performance.
Market Review January 2021

Monthly Market Review – January 2021

VIEW PDF

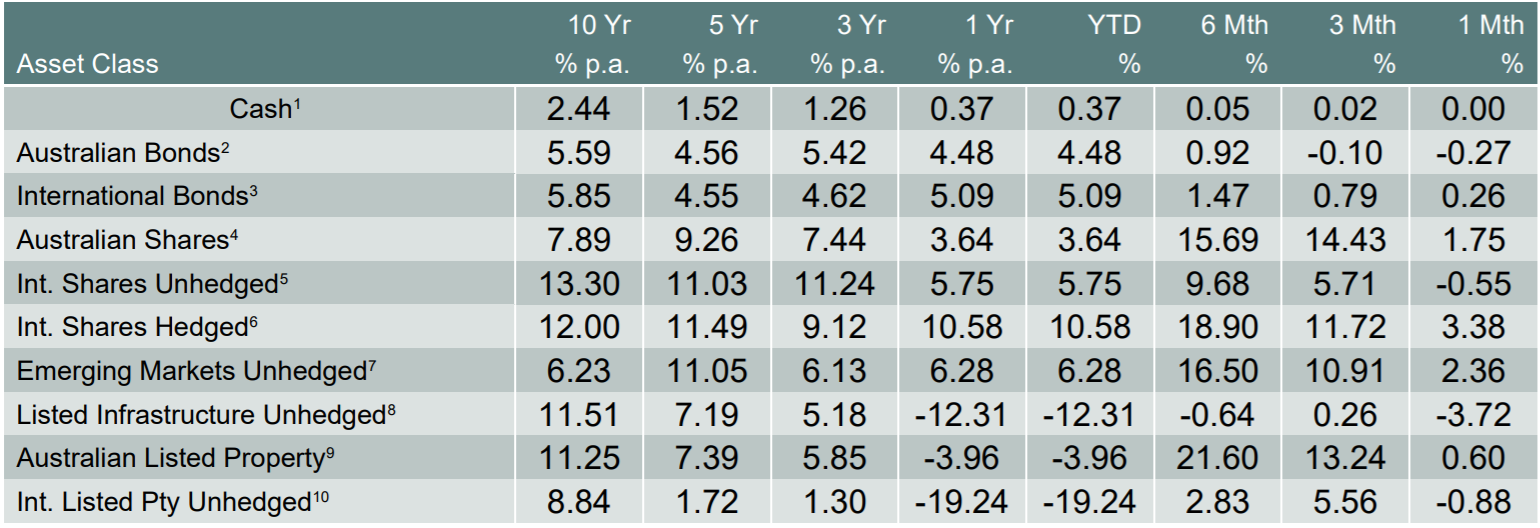
How the different asset classes have fared: (As at 31 January 2021)

1 Bloomberg AusBond Bank 0+Y TR AUD, 2 Bloomberg AusBond Composite 0+Y TR AUD, 3 Bloomberg Barclays Global Aggregate TR Hdg AUD, 4 S&P/ASX All Ordinaries TR, 5 Vanguard International Shares Index, 6 Vanguard Intl Shares Index Hdg AUD TR, 7 Vanguard Emerging Markets Shares Index, 8 FTSE Developed Core Infrastructure 50/50 NR AUD, 9 S&P/ASX 300 AREIT TR, 10 FTSE EPRA/NAREIT Global REITs NR AUD

The year began dramatically. In the US Donald Trump called out to his supporters to help him contest the November US election results, which saw thousands of pro-Trump supporters descend onto the White House. The mob shattered windows, ransacked offices and pounded on barricaded doors. Throughout the chaos, the US stock market continued to rally due to the anticipation of more stimulus for the economy once President Biden enters office.

A disappointing final week of the month led to the S&P/ASX 200 climbing just 0.3% in January. The lackluster performance was linked to investors becoming spooked by extraordinary volatility in stocks with significant short selling exposure. Notwithstanding this most companies saw activity and profits rebound, and with few foreign travel options Australians are spending more at home.

A group of two million members of a Reddit subgroup called r/WallStreetBets (now 10 million members) turned the finance industry upside down late in the month. A short squeeze of the stock of the American video game retailer GameStop and other securities took place, causing major financial consequences for certain hedge funds and large losses for short sellers.

The Australian dollar reached a high of 78 US cents for the month. This has been attributed to rising iron ore prices brought about by news of record-high steel output in China. The strength of the Australian dollar has caused some concern for the RBA due to its impact on growth and inflation.

House prices hit record highs in January, surpassing pre-COVID levels. Every capital city saw an increase in values. This growth can be attributed to various government policies and stimulus measures that helped keep the economy afloat during the pandemic. This included $507 billion in stimulus policies and up to $200 billion by the RBA in near free (0.1 per cent interest) funding for the banks.

Bitcoin experienced a tremendous surge in value. Much of this rise seems to be the result of large flows of institutional money. The current bull run has seen it surpass its previous all-time high of December 2017.

News of several potentially highly effective vaccines against COVID-19 has significantly reduced uncertainty over the global outlook for 2021 and beyond, which is positive for all markets, including Australia. However, there remains the possibility that the existing vaccines may not be effective against all the new mutated COVID-19 variants.

Disclaimer

The information contained in this material is current as at date of publication unless otherwise specified and is provided by ClearView Financial Advice Pty Ltd ABN 89 133 593 012, AFS Licence No. 331367 (ClearView) and Matrix Planning Solutions Limited ABN 45 087 470 200, AFS Licence No. 238 256 (Matrix). Any advice contained in this material is general advice only and has been prepared without taking account of any person’s objectives, financial situation or needs.  Before acting on any such information, a person should consider its appropriateness, having regard to their objectives, financial situation and needs. In preparing this material, ClearView and Matrix have relied on publicly available information and sources believed to be reliable.  Except as otherwise stated, the information has not been independently verified by ClearView or Matrix. While due care and attention has been exercised in the preparation of the material, ClearView and Matrix give no representation, warranty (express or implied) as to the accuracy, completeness or reliability of the information. The information in this document is also not intended to be a complete statement or summary of the industry, markets, securities or developments referred to in the material. Any opinions expressed in this material, including as to future matters, may be subject to change. Opinions as to future matters are predictive in nature and may be affected by inaccurate assumptions or by known or unknown risks and uncertainties and may differ materially from results ultimately achieved. Past performance is not an indicator of future performance.
Market Review December 2020

Monthly Market Review – December 2020

VIEW PDF

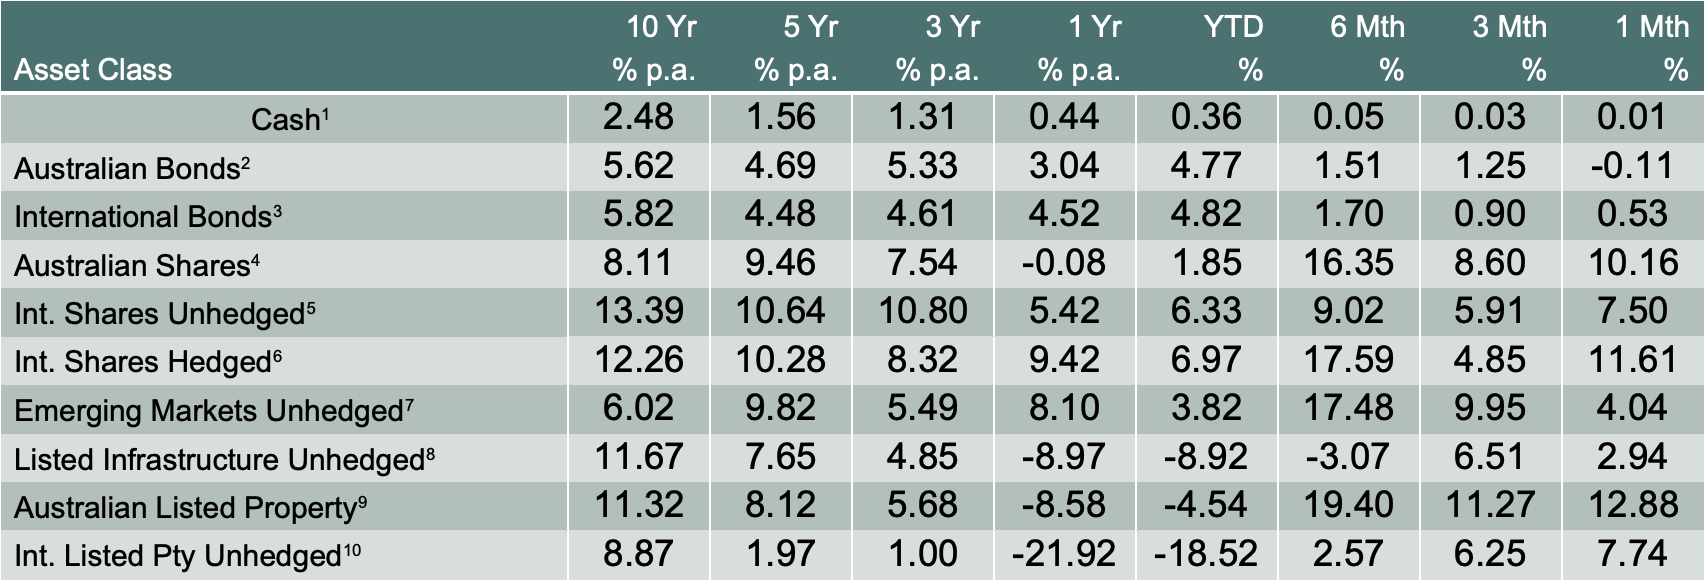
How the different asset classes have fared: (As at 31 December 2020)

1 Bloomberg AusBond Bank 0+Y TR AUD, 2 Bloomberg AusBond Composite 0+Y TR AUD, 3 Bloomberg Barclays Global Aggregate TR Hdg AUD, 4 S&P/ASX All Ordinaries TR, 5 Vanguard International Shares Index, 6 Vanguard Intl Shares Index Hdg AUD TR, 7 Vanguard Emerging Markets Shares Index, 8 FTSE Developed Core Infrastructure 50/50 NR AUD, 9 S&P/ASX 300 AREIT TR, 10 FTSE EPRA/NAREIT Global REITs NR AUD

The ASX All Ords has had a strong start in December before the emergence of a new cluster of COVID-19 cases in Sydney’s northern beaches on 9 December 2020 saw markets tempering expectations of a swift recovery. Despite this, the ASX All Ords returned 1.75% in December 2020. Markets were buoyed by strong commodity prices with iron ore rising 20.0% over the month to be up an astounding 152.9% since its April lows. Strong demand from China and supply disruptions in Brazil were behind the price increases. The surge in commodity prices and overall weakness in the US dollar has seen the Australian dollar trade to $0.76, levels not seen since 2018.

Meanwhile, tensions between Australian and China continued to flare during December 2020, with China banning Australian coal exports and Australia taking up action with the World Trade Organisation. Given China’s high reliance on Australia’s iron ore exports, the impact is expected to be limited. In addition, the incoming Biden administration is expected to try and resolve the US/China tensions in a more diplomatic way, paving the way for Australia to resolve tensions with China too.

New global coronavirus cases continued to climb although at a slower pace. While the mortality rate in developed countries has dropped from 8.5% to around 2.0%, the number of deaths is approaching April highs and some hospitals are at or near capacity. Alarmingly, in the UK, a new strain of COVID-19 was discovered to be more infectious, though not necessarily more severe. This led to more than 40 countries suspending travel with the United Kingdom and a nationwide lockdown.  Thankfully vaccines are still expected to be effective on the new strain. Across the globe vaccines were rolled out, however, supply and transport issues meant the rate of roll out was below expectations. The vaccine rollout is not expected to help with the current wave but should significantly help the recovery in the second half of 2021.

With the rise in global coronavirus cases, major governments around the world continued to reiterate their support for the economy with the ECB and the US committing to stimulus support. The ECB increased its pandemic emergency purchase program from €1.35tn to €1.85tn and extended the program to March 2022. The US also passed a nearly $900bn stimulus bill. While not as large as many had expected the stimulus is big enough to hold off a recession.  Markets reacted positively to these announcements. Finally, after years of negotiation, the Brexit agreement was completed and signed between the UK and the European Union.

 Disclaimer

The information contained in this material is current as at date of publication unless otherwise specified and is provided by ClearView Financial Advice Pty Ltd ABN 89 133 593 012, AFS Licence No. 331367 (ClearView) and Matrix Planning Solutions Limited ABN 45 087 470 200, AFS Licence No. 238 256 (Matrix). Any advice contained in this material is general advice only and has been prepared without taking account of any person’s objectives, financial situation or needs.  Before acting on any such information, a person should consider its appropriateness, having regard to their objectives, financial situation and needs. In preparing this material, ClearView and Matrix have relied on publicly available information and sources believed to be reliable.  Except as otherwise stated, the information has not been independently verified by ClearView or Matrix. While due care and attention has been exercised in the preparation of the material, ClearView and Matrix give no representation, warranty (express or implied) as to the accuracy, completeness or reliability of the information. The information in this document is also not intended to be a complete statement or summary of the industry, markets, securities or developments referred to in the material. Any opinions expressed in this material, including as to future matters, may be subject to change. Opinions as to future matters are predictive in nature and may be affected by inaccurate assumptions or by known or unknown risks and uncertainties and may differ materially from results ultimately achieved. Past performance is not an indicator of future performance.
Market Review November 2020

Monthly Market Review – November 2020

VIEW PDF

How the different asset classes have fared: (As at 30 November 2020)

1 Bloomberg AusBond Bank 0+Y TR AUD, 2 Bloomberg AusBond Composite 0+Y TR AUD, 3 Bloomberg Barclays Global Aggregate TR Hdg AUD, 4 S&P/ASX All Ordinaries TR, 5 Vanguard International Shares Index, 6 Vanguard Intl Shares Index Hdg AUD TR, 7 Vanguard Emerging Markets Shares Index, 8 FTSE Developed Core Infrastructure 50/50 NR AUD, 9 S&P/ASX 300 AREIT TR, 10 FTSE EPRA/NAREIT Global REITs NR AUD

Markets rebounded strongly over November due to a number of factors including RBA cutting interest rates to a record low of 0.10%, in addition, to its announcement of $100bn quantitative easing program, Joe Biden being declared the winner of the US presidential election and positive news regarding COVID-19 vaccines (Pfizer and Moderna).

On 3rd November, the RBA cut the official cash rate from 0.25% to a record low of 0.10%. In addition, it announced a $100 billion quantitative easing program. These actions show the RBA’s unprecedented stance to provide support to the Australian economic recovery and bode well for the domestic economy. The ASX saw a sharp rally following the announcement.

After several days of uncertainty, as the US counted postal votes, Joe Biden was announced as the winner of the US presidential election. The results are usually clear on the night of the election, however, as millions of Americans casted their votes via post due to COVID, there was a delay in the announcement of the winner. This delay created skepticism amongst Trump supporters, paving the way for Trump to declare voter fraud and demanding recounts. Ultimately after some recounts, Joe Biden was declared the winner.

Following the announcement of Joe Biden as the winner of the US presidential election, Pfizer revealed its vaccine results from Phase 3 testing which showed a 90% effectiveness. Not long after, Moderna announced its vaccine results from Phase 3 testing which showed a 94.5% effectiveness. Both announcements are extremely positive results in steps towards normalisation. Markets reacted positively to the news but interestingly during the early days of the announcement markets saw a rotation out of growth stocks towards value stocks. Value continued to outperform growth up until the end of the month.

One major downside over the month was the continued rise of COVID-19 infections, particularly in Europe and the US. With the northern hemisphere heading into winter and the easing of restrictions in August and September, Europe and the US entered a second wave. Most European countries implemented new lockdown measures and some states in the US have started to tighten restrictions. Deaths have remained well below their prior peaks as treatment methods are better. However, the new infection rates are starting to put pressure on the medical system as hospitalisation rates increase. The continued rise in infections will continue to put pressure on any economic recovery for these economies until a vaccine can be rolled out.

Disclaimer

The information contained in this material is current as at date of publication unless otherwise specified and is provided by ClearView Financial Advice Pty Ltd ABN 89 133 593 012, AFS Licence No. 331367 (ClearView) and Matrix Planning Solutions Limited ABN 45 087 470 200, AFS Licence No. 238 256 (Matrix). Any advice contained in this material is general advice only and has been prepared without taking account of any person’s objectives, financial situation or needs.  Before acting on any such information, a person should consider its appropriateness, having regard to their objectives, financial situation and needs. In preparing this material, ClearView and Matrix have relied on publicly available information and sources believed to be reliable.  Except as otherwise stated, the information has not been independently verified by ClearView or Matrix. While due care and attention has been exercised in the preparation of the material, ClearView and Matrix give no representation, warranty (express or implied) as to the accuracy, completeness or reliability of the information. The information in this document is also not intended to be a complete statement or summary of the industry, markets, securities or developments referred to in the material. Any opinions expressed in this material, including as to future matters, may be subject to change. Opinions as to future matters are predictive in nature and may be affected by inaccurate assumptions or by known or unknown risks and uncertainties and may differ materially from results ultimately achieved. Past performance is not an indicator of future performance.
Market Review October 2020

Monthly Market Review – October 2020

VIEW PDF

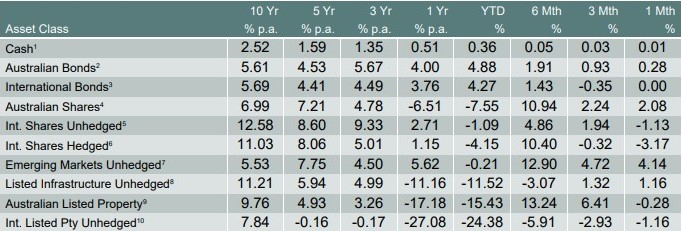
How the different asset classes have fared: (As at 31 October 2020)

The Australian share market performed strongly over October with the S&P/ASX All Ordinaries returning 2.08%, as COVID-19 cases remained low. The end of October saw Victoria’s relaxing of its lockdown restrictions. Data in Australian remained mix. Just over 50% of the jobs and hours cut in April/May have recovered, the remainder is expected to take significantly longer to recover. While new home sales strengthened in September due to HomeBuilder and other incentives.

Global markets were highly volatile in October. Two topics dominated markets over October: rising COVID-19 cases across Europe and the US and the absence of a pre-election fiscal stimulus. October started off strongly as most major indices were up but due to the increasing uncertainties, European and US indices sold off late in the month, giving up all gains and ending negative.

The S&P 500 ended October down -2.7%, as the markets dealt with the rising number of cases in COVID-19, particularly in the mid-west together with the ambiguity regarding a clear presidential winner. European stocks suffered considerably, with the Euro Stoxx 50 down -7.4% for the month, as all major economies reported new highs in inflection rates. Governments across Europe have imposed varying levels of containment measures, which is expected to prevent any near-term recovery. Fortunately, even with higher infection rates, death rates have remained low across Europe and the US due to better testing and treatments.

Asia was the standout region, in particular, China. The MSCI China A International USD returned 3.5% in October, as economic activity in China rebounded strongly. Chinese exports strengthened in September, imports rebounded, and credit growth accelerated.

The two topics that dominated October headlines will continue to substantially impact global markets. The results of the November election will remain in focus, as the outcome will affect the level of fiscal stimulus. While the ability of developing governments to curb infection rates will affect their ability to have a swifter recovery.

Disclaimer

The information contained in this material is current as at date of publication unless otherwise specified and is provided by ClearView Financial Advice Pty Ltd ABN 89 133 593 012, AFS Licence No. 331367 (ClearView) and Matrix Planning Solutions Limited ABN 45 087 470 200, AFS Licence No. 238 256 (Matrix). Any advice contained in this material is general advice only and has been prepared without taking account of any person’s objectives, financial situation or needs. Before acting on any such information, a person should consider its appropriateness, having regard to their objectives, financial situation and needs. In preparing this material, ClearView and Matrix have relied on publicly available information and sources believed to be reliable. Except as otherwise stated, the information has not been independently verified by ClearView or Matrix. While due care and attention has been exercised in the preparation of the material, ClearView and Matrix give no representation, warranty (express or implied) as to the accuracy, completeness or reliability of the information. The information in this document is also not intended to be a complete statement or summary of the industry, markets, securities or developments referred to in the material. Any opinions expressed in this material, including as to future matters, may be subject to change. Opinions as to future matters are predictive in nature and may be affected by inaccurate assumptions or by known or unknown risks and uncertainties and may differ materially from results ultimately achieved. Past performance is not an indicator of future performance.
Market Review September 2020

Monthly Market Review – September 2020

VIEW PDF

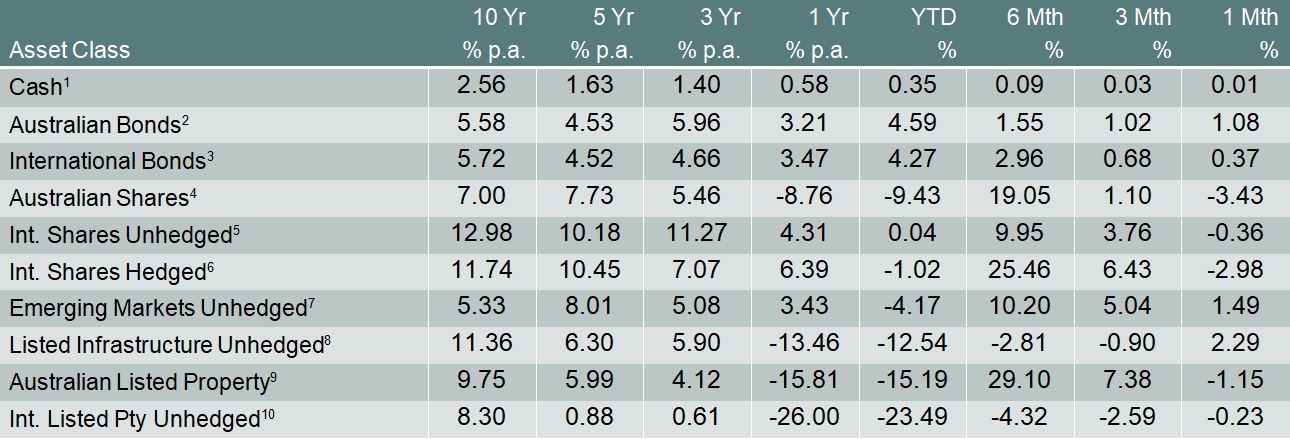
How the different asset classes have fared: (As at 30 September 2020)

1 Bloomberg AusBond Bank 0+Y TR AUD, 2 Bloomberg AusBond Composite 0+Y TR AUD, 3 Bloomberg Barclays Global Aggregate TR Hdg AUD, 4 S&P/ASX All Ordinaries TR, 5 Vanguard International Shares Index, 6 Vanguard Intl Shares Index Hdg AUD TR, 7 Vanguard Emerging Markets Shares Index, 8 FTSE Developed Core Infrastructure 50/50 NR AUD, 9 S&P/ASX 300 AREIT TR, 10 FTSE EPRA/NAREIT Global REITs NR AUD

Australian Dollar and Australian Shares

The Australian dollar fell during September as risk sentiment deteriorated and investors speculated that the Reserve Bank of Australia will further reduce interest rates from 0.25% to 0.1% at its next meeting in early October. The dollar rose slightly as a rally in local and international share markets at the end of the month signaled improving risk sentiment but still finished the quarter down by almost 3%. Australian shares also ended the month lower as a new bout of volatility raised questions about high valuations in IT and consumer discretionary stocks. The prolonged economic shutdown pulled down valuations in commercial real estate.

International Shares and infrastructure

International shares finished the month lower as investor sentiment turned negative with technology stocks dragging down the overall market. The month saw brief rallies following reports of progress on a COVID-19 vaccine. However, concerns about the November election in the US and an increase in European COVID-19 cases weighted heavily on investor sentiment.

Valuations in Europe continue to remain more attractive on a price-to-earnings basis than in the United States but repeated waves of COVID-19 and a poor outlook for the region’s banking system has meant that the regional index has struggled to rise. Japan continued to rally, albeit at a slower pace than in August as the country brought its second wave under control and attractive valuations drew in investment. US shares were more volatile than in July and August as high valuations, particularly in the technology sector, led to volatility.

Emerging Markets

Emerging markets rallied in September given attractive valuations relative to developed market equities. There are headwinds for EM with ongoing US efforts to prevent Chinese companies from accessing the US marketplace which will continue to weigh on sentiment. An end to the sell-off in the US dollar may cause more pain for EM companies and households making purchases of imported goods.

Fixed income

Australian fixed income rallied in September as speculation that the Reserve Bank of Australia will announce further easing at its October meeting placed downward pressure on yields. International fixed-income investors were also helped by central banks. In the US, yields fell as the Federal Reserve signaled it plans to maintain near-zero interest rates until 2023.

Disclaimer

The information contained in this material is current as at date of publication unless otherwise specified and is provided by ClearView Financial Advice Pty Ltd ABN 89 133 593 012, AFS Licence No. 331367 (ClearView) and Matrix Planning Solutions Limited ABN 45 087 470 200, AFS Licence No. 238 256 (Matrix). Any advice contained in this material is general advice only and has been prepared without taking account of any person’s objectives, financial situation or needs. Before acting on any such information, a person should consider its appropriateness, having regard to their objectives, financial situation and needs. In preparing this material, ClearView and Matrix have relied on publicly available information and sources believed to be reliable. Except as otherwise stated, the information has not been independently verified by ClearView or Matrix. While due care and attention has been exercised in the preparation of the material, ClearView and Matrix give no representation, warranty (express or implied) as to the accuracy, completeness or reliability of the information. The information in this document is also not intended to be a complete statement or summary of the industry, markets, securities or developments referred to in the material. Any opinions expressed in this material, including as to future matters, may be subject to change. Opinions as to future matters are predictive in nature and may be affected by inaccurate assumptions or by known or unknown risks and uncertainties and may differ materially from results ultimately achieved. Past performance is not an indicator of future performance.
Market Review August 2020

Monthly Market Review – August 2020

VIEW PDF

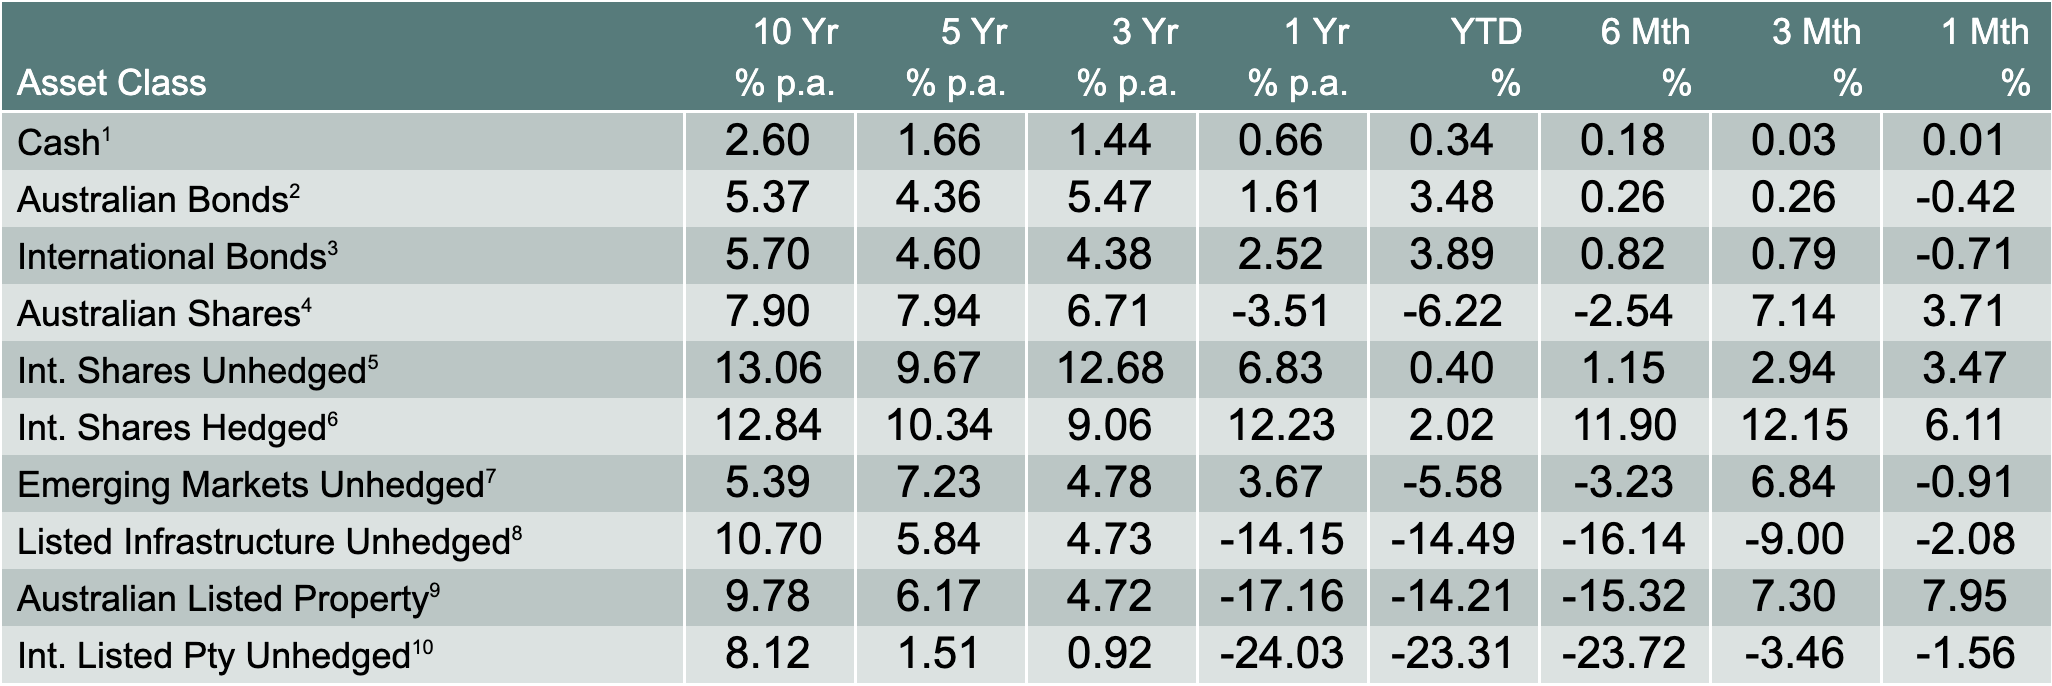
How the different asset classes have fared: (As at 31 August 2020)

1 Bloomberg AusBond Bank 0+Y TR AUD, 2 Bloomberg AusBond Composite 0+Y TR AUD, 3 Bloomberg Barclays Global Aggregate TR Hdg AUD, 4 S&P/ASX All Ordinaries TR, 5 Vanguard International Shares Index, 6 Vanguard Intl Shares Index Hdg AUD TR, 7 Vanguard Emerging Markets Shares Index, 8 FTSE Developed Core Infrastructure 50/50 NR AUD, 9 S&P/ASX 300 AREIT TR, 10 FTSE EPRA/NAREIT Global REITs NR AUD

Financial markets gained in August as US shares recovered their losses and soared to new highs. The Australian dollar surged to nearly 74c by month-end as bearish sentiment drove the US dollar to multi-year lows. International shares also rose strongly in August but gains for unhedged investors were offset by a rise in the Australian dollar. Unlike July, emerging markets retraced some of their gains as fresh tensions between the United States and China sent Chinese stocks tumbling. Government bonds also gave back some of their gains as faith in vaccine trials fueled investor optimism and a rise in bond yields. Listed property and infrastructure also gained on rising optimism about the path of economic recovery but the rising Australian dollar offset gains for unhedged investors.

Cash and Fixed Income

Interest rates remained fixed near zero in August and central banks continued to use their balance sheet to hold down bond yields. The RBA also restarted its purchases of 3-year Australian Government Securities as Stage 4 restrictions in Victoria and new cases in NSW and Queensland impacted economic activity. The central bank has also revised its forecasts for the impact of COVID-19 and now predicts that unemployment will peak at 10%. At the same time, though, pharmaceutical companies and leading universities have now advanced vaccine trials to their third and final stage before potential approval. Bond yields rose moderately (and prices therefore fell) as investors priced in a potential resolution to the global pandemic that has sent yields tumbling across the fixed-income complex.

Australian Shares

The Australian share market gained in August as investors continued to crowd into IT and consumer discretionary stocks. Mining and healthcare stocks largely tracked the index. Unlike in July, though, mining stocks fell and listed property rose on investor optimism that a vaccine for COVID-19, which has seen valuations for shopping centres and office towers fall substantially, might be approved before the end of the year.

International Shares

International share markets soared in August as US shares recovered their losses from earlier in 2020 and closed at all-time highs. International shares continue to be led by US shares, especially investor optimism in the so-called FAANGM (Facebook, Apple, Amazon, Netflix, Google, Microsoft) universe of consumer technology stocks. Unlike in July, Japanese stocks rose strongly as a second wave appeared to gradually subside throughout the month. European stocks continued to underperform – the divergence between valuations in European and US shares is now at its highest level in almost a century.

Emerging Markets

Emerging markets experienced a mild sell-off in July as tensions between the US and China led to new measures from the United States. US President Donald Trump issued an executive order forcing Chinese technology company Bytedance to divest or sell its US operations, leading to a bidding war between US technology companies for its popular app Tiktok. As in developed markets, Chinese technology stocks dominate the emerging markets index. Tencent, Alibaba and Meituan now constitute 38% of the Chinese index and Chinese stocks make up a majority of the emerging markets index. Efforts by the US and other developed countries like Australia and the UK to restrict Chinese technology companies’ access to their markets has therefore had a negative effect on EM valuations.

The Australian Dollar

The Australian dollar rose to almost 74c in August driven mostly by a sell-off in the US dollar. Iron ore prices climbed to $120/ tonne as Chinese appetite for iron ore continued to grow. COVID-19 is still causing issues with supply chain issues in Brazil and other emerging-market iron ore producers, further supporting the price of the bulk commodity. The spread between Australian and US Government, 10-year securities also climbed to 28 basis points by the end of the month, further supporting the Australian dollar (because offshore investors can gain a secure income by exchanging US dollars for Australian dollars and buying local government securities).

Disclaimer

The information contained in this material is current as at date of publication unless otherwise specified and is provided by ClearView Financial Advice Pty Ltd ABN 89 133 593 012, AFS Licence No. 331367 (ClearView) and Matrix Planning Solutions Limited ABN 45 087 470 200, AFS Licence No. 238 256 (Matrix). Any advice contained in this material is general advice only and has been prepared without taking account of any person’s objectives, financial situation or needs.  Before acting on any such information, a person should consider its appropriateness, having regard to their objectives, financial situation and needs. In preparing this material, ClearView and Matrix have relied on publicly available information and sources believed to be reliable.  Except as otherwise stated, the information has not been independently verified by ClearView or Matrix. While due care and attention has been exercised in the preparation of the material, ClearView and Matrix give no representation, warranty (express or implied) as to the accuracy, completeness or reliability of the information. The information in this document is also not intended to be a complete statement or summary of the industry, markets, securities or developments referred to in the material. Any opinions expressed in this material, including as to future matters, may be subject to change. Opinions as to future matters are predictive in nature and may be affected by inaccurate assumptions or by known or unknown risks and uncertainties and may differ materially from results ultimately achieved. Past performance is not an indicator of future performance.

Market Review July 2020

Monthly Market Review – July 2020

VIEW PDF

How the different asset classes have fared: (As at 31 July 2020)

1 Bloomberg AusBond Bank 0+Y TR AUD, 2 Bloomberg AusBond Composite 0+Y TR AUD, 3 Bloomberg Barclays Global Aggregate TR Hdg AUD, 4 S&P/ASX All Ordinaries TR, 5 Vanguard International Shares Index, 6 Vanguard Intl Shares Index Hdg AUD TR, 7 Vanguard Emerging Markets Shares Index, 8 FTSE Developed Core Infrastructure 50/50 NR AUD, 9 S&P/ASX 300 AREIT TR, 10 FTSE EPRA/NAREIT Global REITs NR AUD

Financial markets were mixed in July as a sell-off in the US dollar and promising earnings reports from US technology giants fueled investor enthusiasm. However new COVID-19 outbreaks across the world undermined faith in the economic recovery. The Australian dollar surged to US 72c by month-end as bearish sentiment drove the US dollar to multi-year lows. International shares also rose strongly in July but gains for unhedged investors were offset by a rise in the Australian dollar. As in June, emerging markets also enjoyed robust gains as a sell-off in the US dollar eased financial conditions in developing countries and investors bought into Chinese technology companies that are likely to benefit from changes to commerce during the global pandemic. Government bonds largely traded sideways as central banks around the world maintained ultra-low interest rates. International bond yields fell (and prices therefore rose) in large part because new viral outbreaks dampened faith in the economic recovery from COVID-19. Small gains in listed infrastructure and global listed property were offset for unhedged investors by the rising Australian dollar.

Cash and Fixed Income

Interest rates remained fixed near zero in July and central banks continued to use their balance sheet to hold down bond yields. International and Australian bonds rallied as a resurgence of COVID-19 cases in Australia and overseas renewed fears of deflation and a prolonged downturn. The RBA kept rates fixed close to zero but allowed rates on 3-year Australian Government Securities to float above their target of 0.25% during July (rates peaked at 0.28% in the middle of the month). The RBA has subsequently pledged to restart its purchases as a new lockdown in Victoria and the closure of state borders placed new pressure on the Australian economy.

Australian Shares

The Australian share market was relatively subdued in July, returning 0.95% for the month. New restrictions on domestic movement following the outbreak in Victoria and new clusters in NSW have set back the clock for the economic recovery. The RBA has revised its estimates for the Australian economy and now expects unemployment to peak at around 10%.

The increase in the ASX 200 index was largely driven by mining and technology stocks. Mining stocks outperformed as Chinese stimulus buoyed prices in international markets and the IT sector strengthened as investors gain faith in the long-term beneficial impact of COVID-19 on e-commerce providers. Healthcare and bank stocks dragged in July as a second wave of infections in Victoria and NSW undermined recent gains and undermined faith in the recovery.

International Shares

International share markets gained momentum in July as strong earnings reports from US technology companies fueled a surge in prices and renewed investor optimism in the so-called FAANGM (Facebook, Apple, Amazon, Netflix, Google, Microsoft) universe of consumer technology stocks. The S&P 500 finished the month strongly enough to offset falls in Europe and Japan’s equity markets.

Emerging Markets

Emerging markets were also supported by new inflows and investors’ growing appetite for risk. As in developed markets, Chinese technology stocks like Tencent and Alibaba have attracted significant new investment as investors look for companies that are likely to gain from the global pandemic.

The Australian Dollar

The Australian dollar rose to 72c in July in large part driven by a sell-off in the US dollar. A worsening COVID-19 outbreak in Victoria and news that Australian consumer prices had fallen at the fastest quarterly rate since 1931 failed to dampen investor sentiment. Iron ore prices climbed more than 10% as Chinese stimulus fueled new demand for Australian bulk commodities.

Disclaimer

The information contained in this material is current as at date of publication unless otherwise specified and is provided by ClearView Financial Advice Pty Ltd ABN 89 133 593 012, AFS Licence No. 331367 (ClearView) and Matrix Planning Solutions Limited ABN 45 087 470 200, AFS Licence No. 238 256 (Matrix). Any advice contained in this material is general advice only and has been prepared without taking account of any person’s objectives, financial situation or needs. Before acting on any such information, a person should consider its appropriateness, having regard to their objectives, financial situation and needs. In preparing this material, ClearView and Matrix have relied on publicly available information and sources believed to be reliable. Except as otherwise stated, the information has not been independently verified by ClearView or Matrix. While due care and attention has been exercised in the preparation of the material, ClearView and Matrix give no representation, warranty (express or implied) as to the accuracy, completeness or reliability of the information. The information in this document is also not intended to be a complete statement or summary of the industry, markets, securities or developments referred to in the material. Any opinions expressed in this material, including as to future matters, may be subject to change. Opinions as to future matters are predictive in nature and may be affected by inaccurate assumptions or by known or unknown risks and uncertainties and may differ materially from results ultimately achieved. Past performance is not an indicator of future performance.

Market Review June 2020

Monthly Market Review – June 2020

VIEW PDF

How the different asset classes have fared: (As at 30 June 2020)

1 Bloomberg AusBond Bank 0+Y TR AUD, 2 Bloomberg AusBond Composite 0+Y TR AUD, 3 Bloomberg Barclays Global Aggregate TR Hdg AUD, 4 S&P/ASX All Ordinaries TR, 5 Vanguard International Shares Index, 6 Vanguard Intl Shares Index Hdg AUD TR, 7 Vanguard Emerging Markets Shares Index, 8 FTSE Developed Core Infrastructure 50/50 NR AUD, 9 S&P/ASX 300 AREIT TR, 10 FTSE EPRA/NAREIT Global REITs NR AUD

Financial markets were slightly more subdued in June than in April and May as the reopening of economies caused new outbreaks in the Americas, Middle East and India. Australian shares and the local currency rose, buoyed by authorities’ relative success at containing the local epidemic. International shares also rose modestly in June but gains for unhedged investors were offset by a rise in the Australian economy. Emerging markets rose more robustly as an economic recovery in China and successful containment of viral outbreaks in Asia raised investor confidence. Government bonds largely traded sideways as central banks around the world maintained ultra-low interest rates and asset purchases while credit spreads narrowed as the economic reopening continued. Listed infrastructure underperformed in June as investors priced in the effects of a pandemic with multiple waves on sensitive infrastructure assets like toll roads and airports.

Cash and Fixed Income

Interest rates remained fixed near zero in June and central banks continued to use their balance sheet to hold down bond yields. Investment-grade spreads narrowed as Federal Reserve purchases of bond ETFs (exchange-traded funds) drew in new investment and raised prices while government and high-yield bonds largely traded sideways.

Australian Shares

The Australian share market extended its rally with another gain of 2.34% in June. An increase in the ASX 200 index was largely driven by banks, IT and consumer stocks. Mining stocks underperformed the index as a whole as Brazilian mining supply gradually came back online. A new outbreak in Victoria towards the end of June placed some downward pressure on prices, as well as the Australian dollar as the state was forced to reintroduce selective lockdowns to contain the spread of COVID-19.

International Shares and Emerging Markets

International share markets continued to recover in June although the incremental improvement in valuations was smaller and accompanied by much greater volatility. As in May, the global economic reopening and a continuation of extraordinary fiscal and monetary support supported higher valuations, but new outbreaks nevertheless forced localized lockdowns or a delay in reopening.

Once again, though, US IT stocks outperformed even as news of a Facebook advertiser boycott briefly shook investors’ optimism in the mega-cap tech stocks. International shares are now trading around the same price-to-earnings ratio that they were before the pandemic. Emerging markets were also supported by new inflows and an investors’ growing appetite for risk after the sell-off in March.

The Australian Dollar

The Australian dollar continued to rise in June. However, the local currency trimmed rapid gains at the beginning of the month by the end of June as a new outbreak and some adverse economic data dampened investor sentiment. Iron ore prices remained steady as Brazilian miner Vale, which has been heavily impacted by the COVID-19 crisis in Brazil, gradually brought more supply to the market. The Australia/US interest rate differential (the difference between yields on 10-year US and Australian government bonds) has stabilized at around 25 basis points, which means that investors earn more from holding Australian government bonds. Along with a gradual increase in investors’ appetite for risk and Australia’s apparent success at controlling the coronavirus, the interest-rate differential helped the Australian dollar finish the month at just under 69c.

In a world full of choices,
this is why our clients chose us:

Over the years, we have come to rely on Sherlock Wealth to take care of all our financial affairs and to see Andrew as

Dr. Bruce Walker

Read more

I have been a client of the Sherlocks for more than 40 years. The sound advice I have received from Andrew in relation to building wealth

Mark Worrall

Read more

We wanted to express our enormous thanks to you and your team. First of all for your sage advice in terms of the

Trauma Claim

Read more

Since becoming a Sherlock Wealth client, my wife Jacinta and I have never felt more than in control of our

Rob and Jacinta Jones

Read more

Having busy lives, we truly value the advice and care that Andrew and the team at Sherlock Wealth provide with

Rachel and Brett Lunn

Read more

I would say to anyone that you have to prioritise your financial affairs as an important part of your life

Jo Masters

Read more

Want to know more?
Sign up to our e-news today!

    YOUR SUCCESS IS OUR PASSION +612 8247 9900